by admin | Jul 17, 2018
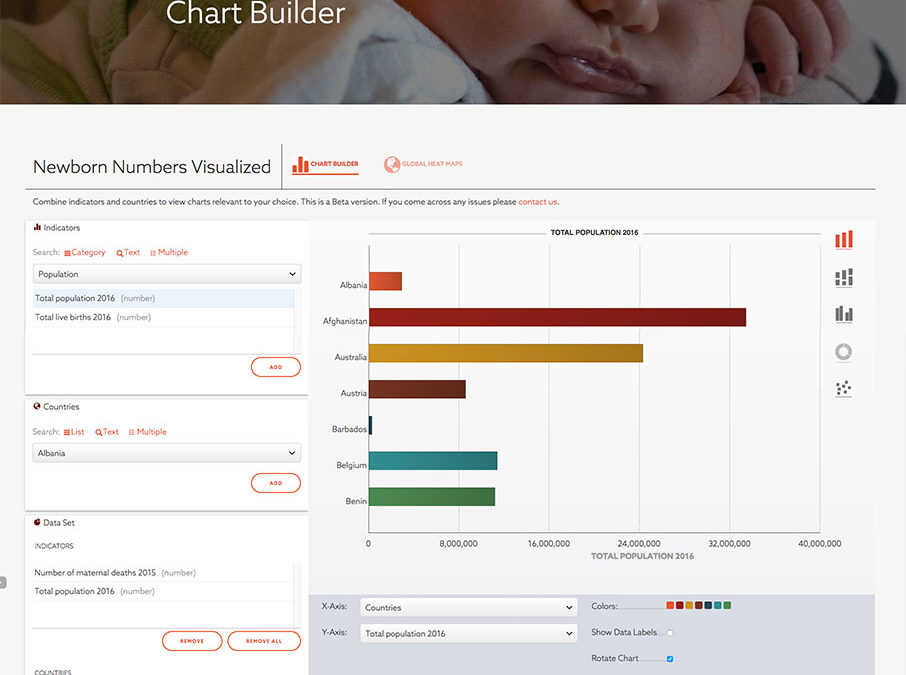
This chart building tool for the Healthy Newborn Network, a division of Save the Children, helps users compare maternal and newborn health statistics for countries and builds a customizable chart suited to the data requested. An alternate view shows a color-coded...
by admin | Jul 15, 2018
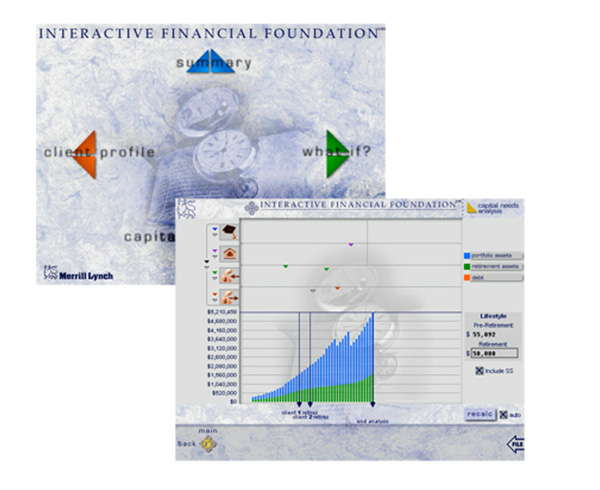
Interactive Financial Foundation(sm) was the firm’s core financial planning application, offering Financial Advisors a complete, easily updated, and interactive view of each client’s situation. Client: Merrill Lynch
by admin | Jul 13, 2018
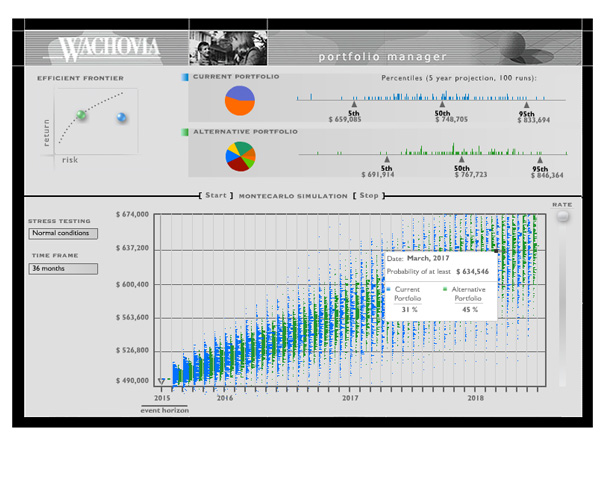
Monte Carlo simulation is used to predict portfolo growth. The viewer can choose any asset allocation on the efficient frontier and view the future outcome. Client: Wachovia
by admin | Jul 12, 2018
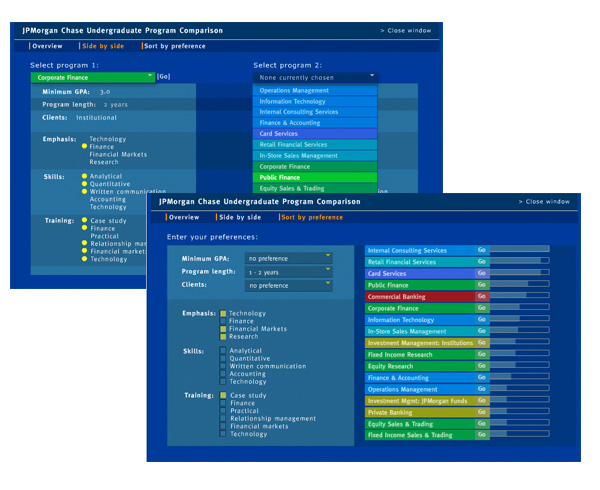
Many firms offer charts that describe programs or business units. This tool allows students to enter their own preferences for sorting, taking comparison to a higher level. Client: JPMorgan Chase
by admin | Jul 9, 2018
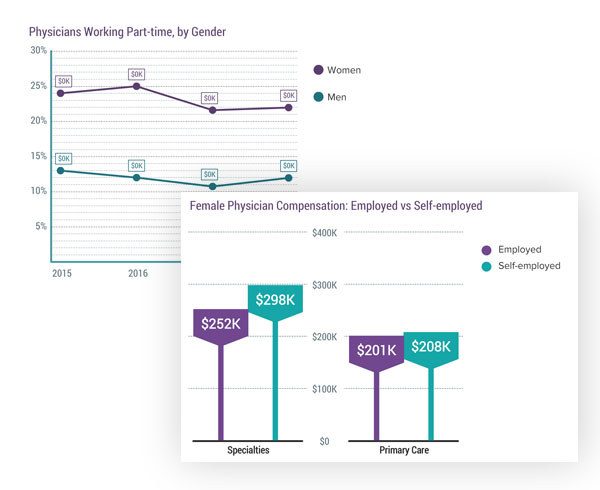
My software dynamically generates hundreds of chart-based visualizations, based on data analyzed from physician surveys that cover up to 27 medical specialties, which our medical editors use to write articles and captions for the Medscape audience. Client: Medscape...





Recent Comments