by admin | Jul 8, 2018
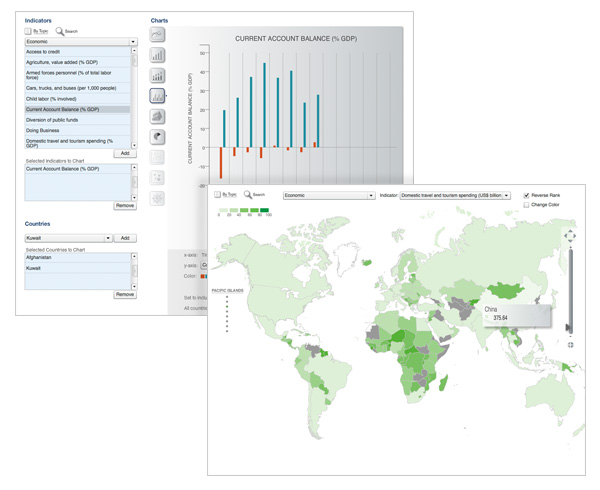
A web-based tool lets data analysts compare any countries across hundreds of measurable indicators, generate an appropriate chart-based visualization and export both data and graphics from the analysis. Client: U.S. Government

by admin | Jul 5, 2018
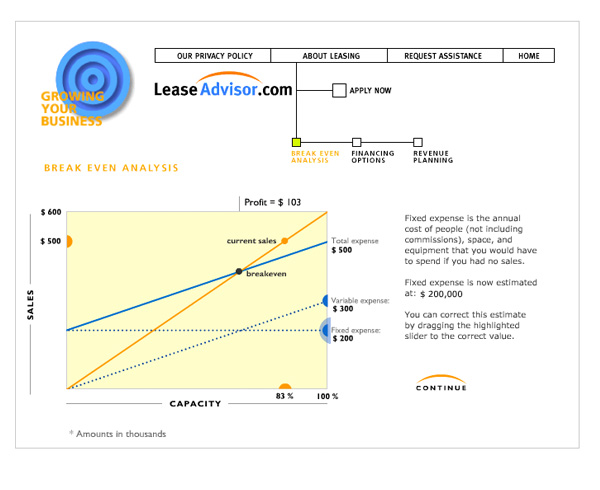
With just a few numbers familiar to any businessperson, profitability may be explored by changing the determining variables. Client: Lease Advisor

by admin | Jul 2, 2018
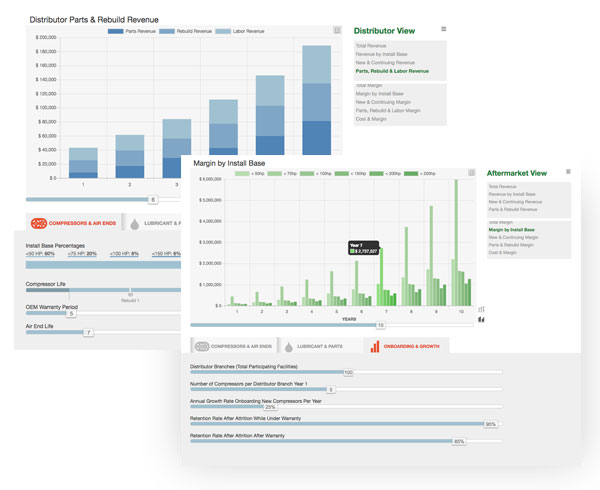
This interactive sales tool for a chemical industry company was designed as a powerful demonstration of short and long-term projections for a new revenue stream.


Recent Comments