by admin | Jul 19, 2018
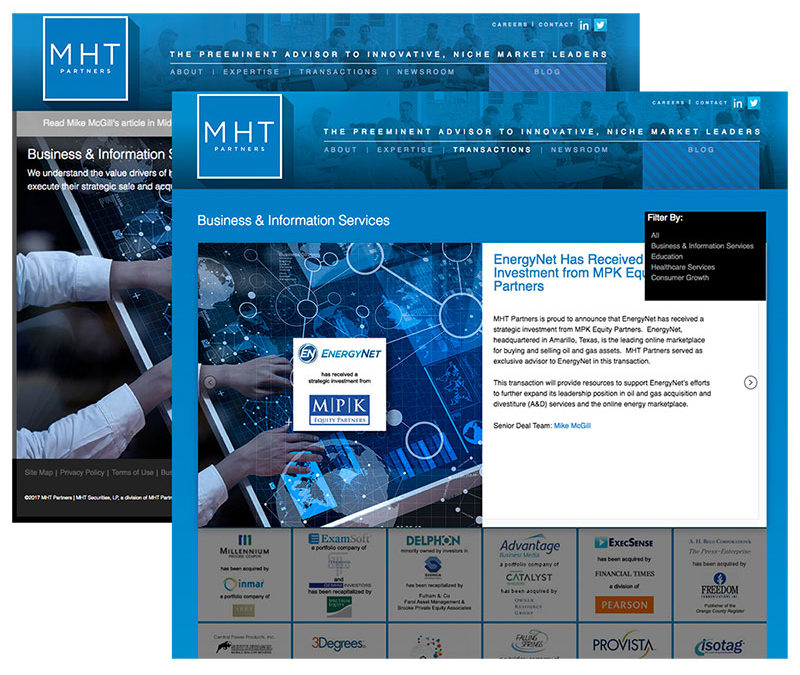
For MHT Partners, this WordPress theme includes a powerful animated filtering interface designed to display a wide array of business transactions within several different industries. Client: MHT Partners Link:...
by admin | Jul 17, 2018
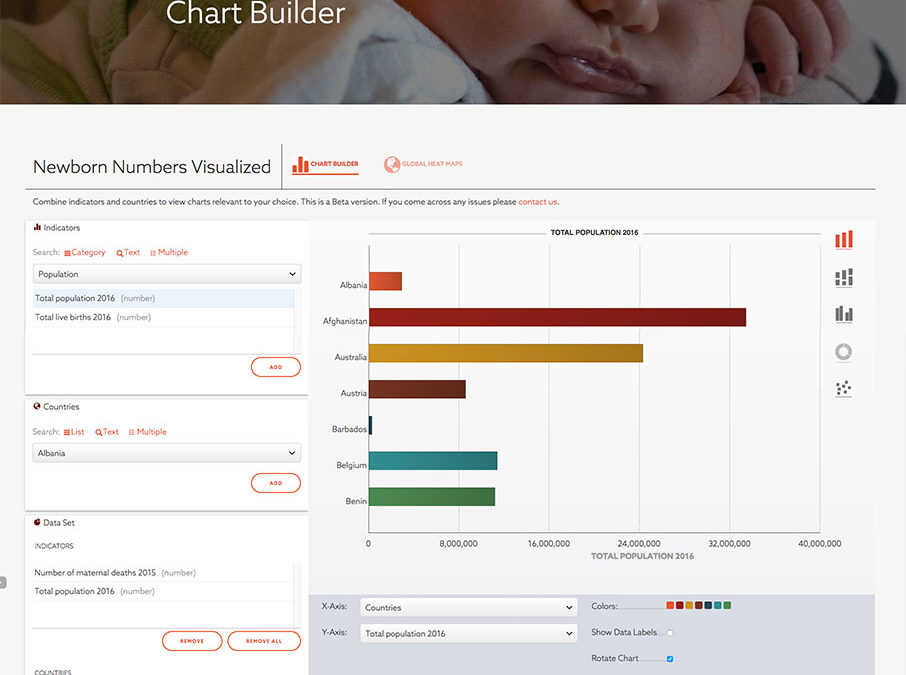
This chart building tool for the Healthy Newborn Network, a division of Save the Children, helps users compare maternal and newborn health statistics for countries and builds a customizable chart suited to the data requested. An alternate view shows a color-coded...
by admin | Jul 14, 2018
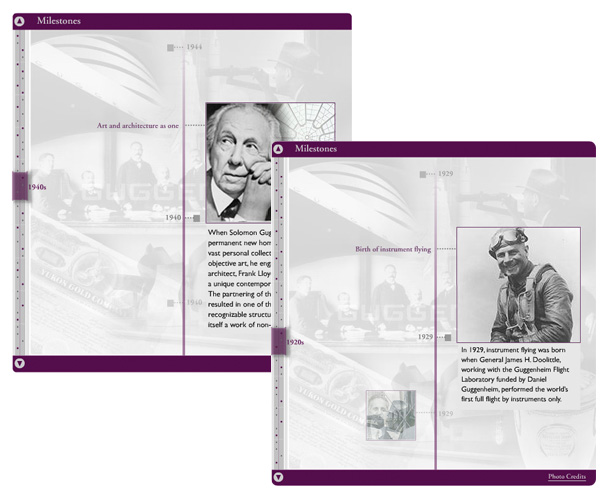
This illustration allows the viewer to browse through Guggenheim’s illustrious history. The viewer may click on points along the way to reveal more information. Client: Guggenheim Partners
by admin | Jul 13, 2018
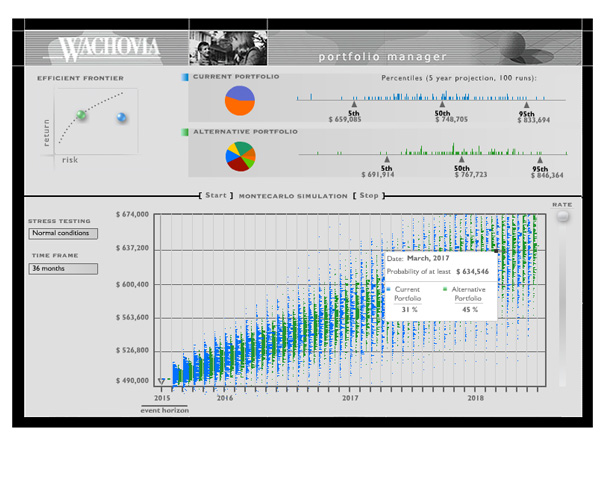
Monte Carlo simulation is used to predict portfolo growth. The viewer can choose any asset allocation on the efficient frontier and view the future outcome. Client: Wachovia
by admin | Jul 12, 2018
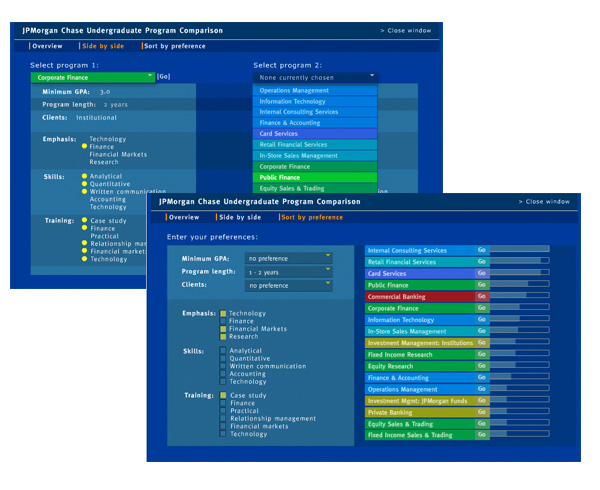
Many firms offer charts that describe programs or business units. This tool allows students to enter their own preferences for sorting, taking comparison to a higher level. Client: JPMorgan Chase





Recent Comments