by admin | Jul 10, 2018
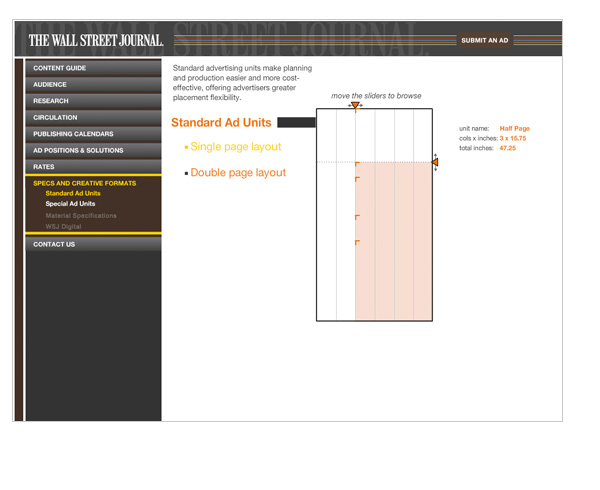
Standard and Special ad units are described interactively on the Wall Street Journal website for advertising sales. Client: Wall Street Journal

by admin | Jul 9, 2018
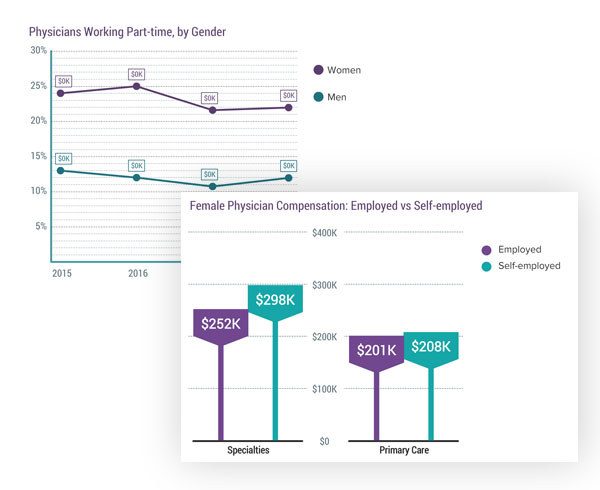
My software dynamically generates hundreds of chart-based visualizations, based on data analyzed from physician surveys that cover up to 27 medical specialties, which our medical editors use to write articles and captions for the Medscape audience. Client: Medscape...

by admin | Jul 8, 2018
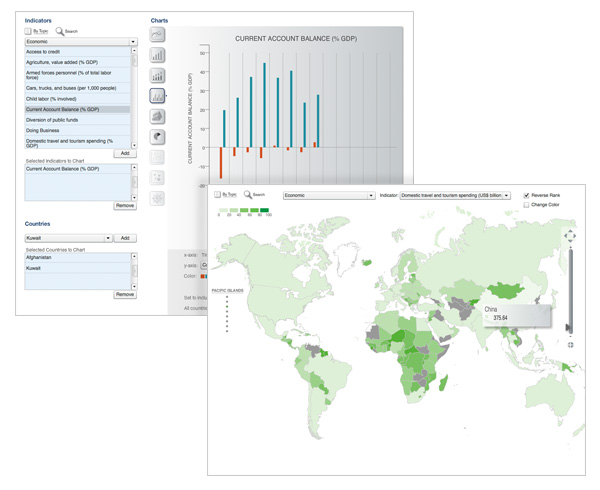
A web-based tool lets data analysts compare any countries across hundreds of measurable indicators, generate an appropriate chart-based visualization and export both data and graphics from the analysis. Client: U.S. Government

by admin | Jul 7, 2018
Lifetime cost analysis strategies and calculations that had been previously presented in spreadsheet form now show decision making results graphically. Client: ITT

by admin | Jul 6, 2018
A Flash tool helps AQS visualize the structure of their market and demonstrate the various relationships among members. Client: AQS


Recent Comments